
Introduction
In today’s data-driven world, Excel has become more than just a spreadsheet tool. It is now a powerful analytics platform used by professionals across fields. Among all the modern features Excel offers, Power Query stands out as one of the most important tools for data cleaning, transformation, and automation. Whether you are a beginner or an experienced data analyst, Power Query can save hours of manual work, eliminate errors, and help you prepare data instantly.
This in-depth guide provides a complete overview of Power Query, explaining what it is, how it works, key features, benefits, real-life use cases, and hands-on examples. By the end of this article, you’ll clearly understand why Power Query is essential for every Excel user.
What is Power Query? (Brief Explanation)
Power Query is a data transformation and automation tool in Excel that helps you:
- Connect to multiple data sources
- Clean and transform data
- Automate data refresh
- Combine and reshape tables
- Create repeatable workflows
Think of Power Query as your personal data cleaning machine. Anything you do once can be refreshed again with a single click.
What is Power Query? (In-Depth Explanation)
Power Query is built on a powerful language called M Language (Mashup Language).
When you apply steps in Power Query—like removing duplicates, splitting columns, or merging tables—Excel automatically writes M code in the background. This makes your transformation steps repeatable and dynamic.
Power Query works inside the Power Query Editor, which has a clean, user-friendly interface where you can see:
- Queries Pane – list of all queries
- Preview Pane – preview of your data
- Applied Steps Pane – history of every step
- Formula Bar – shows M code
Power Query follows a structured pipeline:
- Connect → Load data from any source
- Transform → Clean, reshape, modify
- Combine → Merge, append, join
- Load → Load to Excel sheet or Data Model
- Refresh → Auto-update everything in seconds
This makes Power Query a game changer for handling messy or repetitive data.
Where is Power Query in Excel?
Power Query is available under:
Excel 2016 and later
Go to Data → Get & Transform Data.
Excel 2010 & 2013
Install the free Microsoft Power Query add-in.
Why Power Query is Important
Most data analysts spend 70% of their time cleaning data. Power Query reduces this drastically by:
✔ Automating repetitive tasks
✔ Eliminating manual errors
✔ Handling large datasets
✔ Building repeatable workflows
✔ Connecting multiple sources
It saves hours of work every week and improves data reliability.
Key Features of Power Query (Simple Explanation)
1. Connect to Multiple Data Sources
Power Query supports 80+ connectors, including:
- Excel files
- CSV, TXT, XML
- SQL Servers
- SharePoint
- Web URLs
- JSON files
- Online services (Salesforce, Azure, Power BI, etc.)
2. Powerful Data Cleaning Tools
You can clean data without formulas using:
- Remove duplicates
- Trim & clean
- Replace values
- Split columns
- Merge columns
- Remove blank rows
- Change data types
3. Transform Data Easily
Common transformations include:
- Pivot & Unpivot
- Group By
- Sorting
- Filtering
- Conditional columns
- Adding custom columns
4. Combine Data from Multiple Sources
You can:
- Merge Queries → Join like SQL
- Append Queries → Stack tables (like UNION)
5. Automatic Refresh
Once a query is ready, click Refresh to get updated results instantly.
6. M Language Automation
Behind every step, Power Query writes M code, making the process dynamic and programmable.
7. Load Options
You can load data:
- To Excel sheet
- To Excel Data Model
- As connection only (to use later)
Power Query Interface – Complete Breakdown
When you open Power Query Editor, you see:
1. Home Tab
Main functions like:
- Load & Close
- Refresh
- Remove rows
- Keep rows
- Combine queries
2. Transform Tab
For cleaning and formatting:
- Data types
- Splitting
- Formatting
- Pivot/unpivot
3. Add Column Tab
For creating:
- Custom columns
- Conditional columns
- Index columns
4. View Tab
Controls:
- Formula bar
- Column quality
- Column distribution
5. Queries Pane
Shows all your queries.
6. Applied Steps Pane
Tracks every step applied to your data.
Most Important Power Query Transformations (Explained)
1. Remove Duplicates
Quickly remove duplicates from any column.
2. Split Column
Useful for:
- Splitting full names
- Splitting email IDs
- Extracting codes
3. Merge Columns
Create unique IDs or combine first name + last name.
4. Merge Queries (Join Tables)
Just like SQL joins:
- Left join
- Right join
- Inner join
- Full outer join
5. Append Queries
Stack tables from multiple sources.
6. Unpivot Columns
Best for converting cross-tab data into a usable format.
7. Extract Text
You can extract:
- Before/after delimiter
- Start of text
- End of text
8. Replace Values
Fix issues like:
- NA → Null
- Wrong spellings
- Incorrect text
Step-by-Step Example: Load & Clean Data
Scenario:
You receive monthly sales data from 12 different Excel files and need to combine all into one.
Steps:
Step 1: Connect Folder
- Data → Get Data → From File → From Folder
- Select the folder containing all files
Step 2: Combine & Transform
- Click Combine & Transform
- Power Query automatically merges all files
Step 3: Clean the Data
- Remove blank columns
- Change data types
- Remove errors
- Rename columns
Step 4: Load
- Click Close & Load
- Your combined master table is ready
Step 5: Automate
Next month, just paste new files into the folder → click Refresh → all updates happen automatically.
Power Query vs Traditional Excel Methods
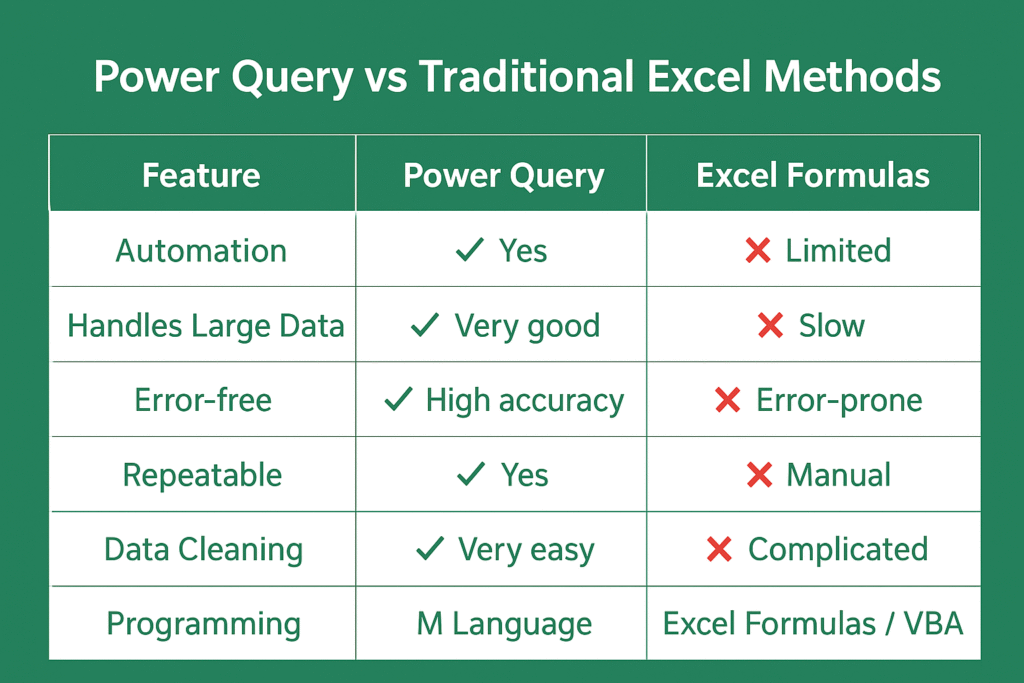
Power Query vs Power Pivot vs Power BI
| Tool | Function |
|---|---|
| Power Query | Data cleaning & shaping |
| Power Pivot | Data modeling & relationships |
| Power BI | Advanced reporting & dashboards |
Power Query is used in all three tools, making it a universal skill.
Real-Life Use Cases of Power Query
1. HR Department
- Clean employee master data
- Combine monthly attendance sheets
- Generate salary inputs
2. Finance
- Combine GST files
- Clean bank statements
- Prepare MIS reports
3. Sales & Marketing
- Merge CRM + Excel data
- Clean leads data
- Create automated reports
4. Operations
- Clean order data
- Track inventory
- Combine weekly customer orders
5. Data Analytics
- Prepare datasets
- Connect SQL + Excel
- Build automated ETL pipelines
Best Practices for Using Power Query
✔ Always rename steps
✔ Keep column names clean
✔ Remove unnecessary steps
✔ Use “Connection Only” queries
✔ Use folders for automatic combining
✔ Avoid loading unnecessary data
✔ Check “Column Quality” and “Column Distribution”
✔ Document your transformations
Power Query Limitations
While Power Query is powerful, it has some limitations:
- Cannot refresh without opening Excel (unless using Power Automate)
- M Language is less popular than Python/SQL
- Complex transformations require coding
- Refreshing large datasets may take time
Advanced Power Query Concepts
1. Parameters
Create dynamic queries where users can input:
- Dates
- File paths
- Filters
2. Custom Functions
Reusable M language functions.
Example:
- Extract domain from email
- Convert timezone
- Clean text formats
3. M Language Basics
Common M functions:
Text.Split()Table.TransformColumns()List.Generate()Table.AddColumn()
4. Query Folding
Optimization that pushes query logic back to the database.
Speeds up performance.
5. Incremental Refresh
Refreshes only new or changed rows.
Power Query Tips & Tricks (For Faster Work)
- Use “Remove Other Columns” instead of selecting many columns
- Combine multiple files using the Folder Connector
- Use Date and Time parsing features
- Use “Group By” to calculate totals, averages, counts
- Use “Fill Down” and “Fill Up” for missing data
- Check column quality to find errors quickly
Why Power Query is a Must-Learn Skill
If you deal with data regularly, Power Query is not optional—it is mandatory.
You should learn Power Query because it:
✔ Saves 80% of your time
✔ Automates repetitive tasks
✔ Eliminates manual cleaning
✔ Prepares complex datasets easily
✔ Works with huge data
✔ Connects with Power BI
✔ Increases career value
Companies prefer analysts who know Power Query because it improves accuracy and productivity.
Conclusion
Power Query is one of the most powerful and user-friendly tools inside Excel. It transforms the way you clean, reshape, and prepare data. Whether you are a beginner or a seasoned data analyst, mastering Power Query will help you save hours of work, reduce errors, and build automated workflows.
From connecting data sources to creating repeatable cleaning steps, Power Query provides an end-to-end solution for data preparation. As the world becomes more data-driven, learning tools like Power Query will give you a major advantage in your analytics career.
If you want to grow in data analysis, Power BI, Excel automation, or reporting—Power Query is the first skill you must master.